Dashboard
Summary
The dashboard is the first screen that users will see when they log in to IXO Commerce. This shows essential summaries of several reports and various other elements to present a snapshot of the business as it pertains to their role, along with shortcuts to key actions.
The Dashboard may be viewed inclusive or exclusive of VAT (with a couple of exceptions) - this is controlled through Site Settings. All users must share the same view.
Dashboard Blocks
Your Dashboard is made up of a variety of widgets; this view is unique to each User based on their permissions. The Dashboard can be rearranged or individual widgets can be hidden as desired.
There is a 'reset dashboard' button at the bottom of the screen.
Widget visibility is controlled via user permissions on the Update User screen.
Baskets

Displays if the user is enabled for 
This will display the number of active eCommerce baskets on your website, along with a filtered clickthrough.
A conversion rate will also display if the user is enabled for 
The conversion rate is calculated as a percentage of converted Sales Orders with the Source of 'WEBSITE' (e.g. converted orders vs abandoned orders).
Bandwidth

Displays if the user is a 
Displays your Bandwidth allowance, along with your usage so far this month compared to last month.
If your Bandwidth is consistently higher that your allowance, Iconography will be in touch to discuss increasing your allowance; if it is consistently over 100GB a month, we will mandate a dedicated server.
Current Order Book
This will always display inclusive of VAT
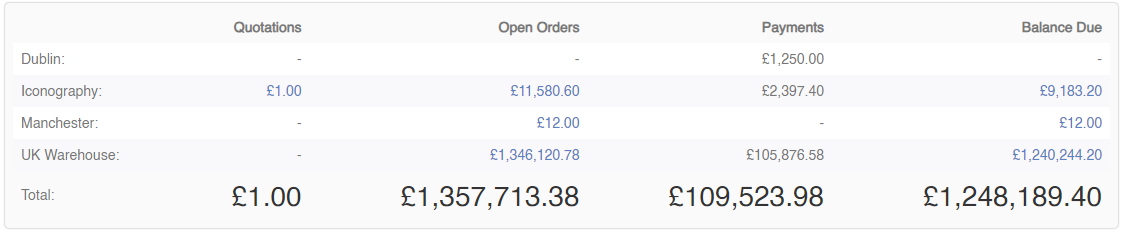
Displays if the user is enabled for 
This will display the total value of all (unexpired) Quotes. It also showsthe total value of open Sales Orders, along with a breakdown of current payments and outstanding balances against those Sales Orders.
This will be broken down by Store.
Last 12 Months/Average Order Value
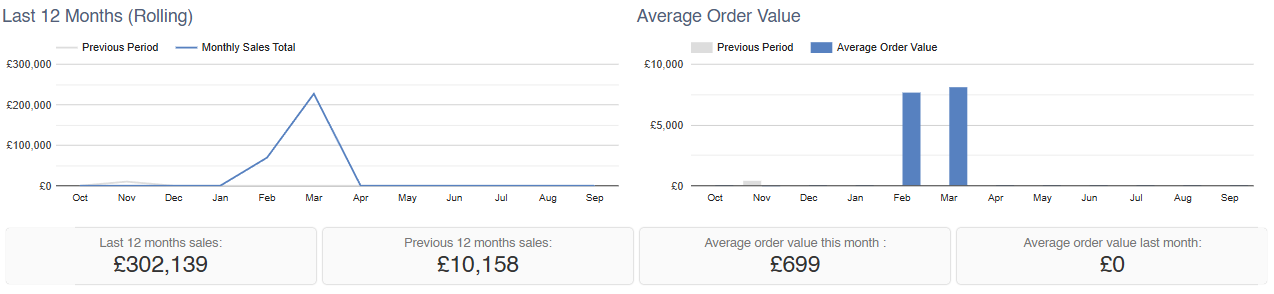
Displays if the user is enabled for 
Last 12 Months
This will show year on year sales performance for the last 12 months.
Average Order Value
This will show year on year average order value for the last 12 months.
Last 14 Days (Year on Year)
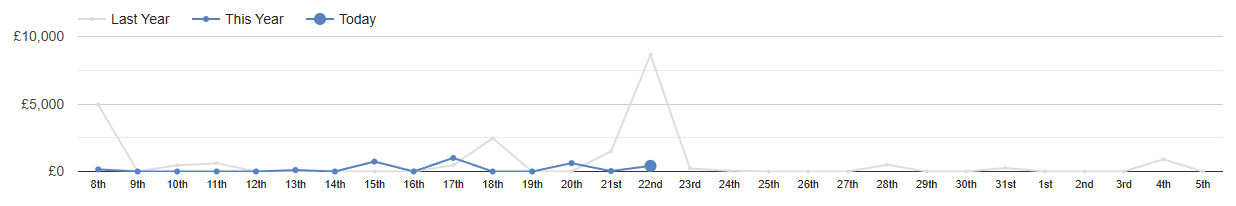
Displays if the user is enabled for
This will show year on year sales performance for the last 30 days.
Orders
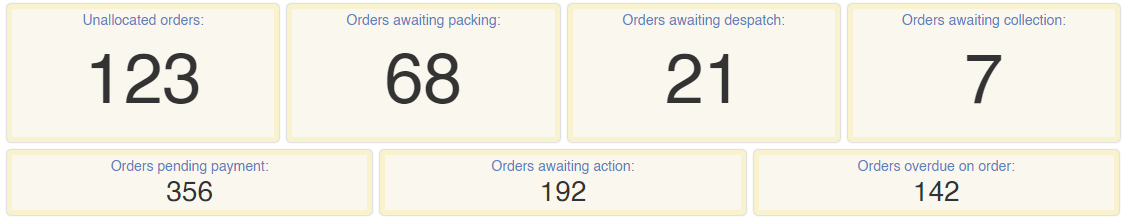
Displays if the user is enabled for
This displays orders which require action; each section is a link to process the highlighted Sales Orders.
Products
The value of Total Stock Held will always show exclusive of VAT.
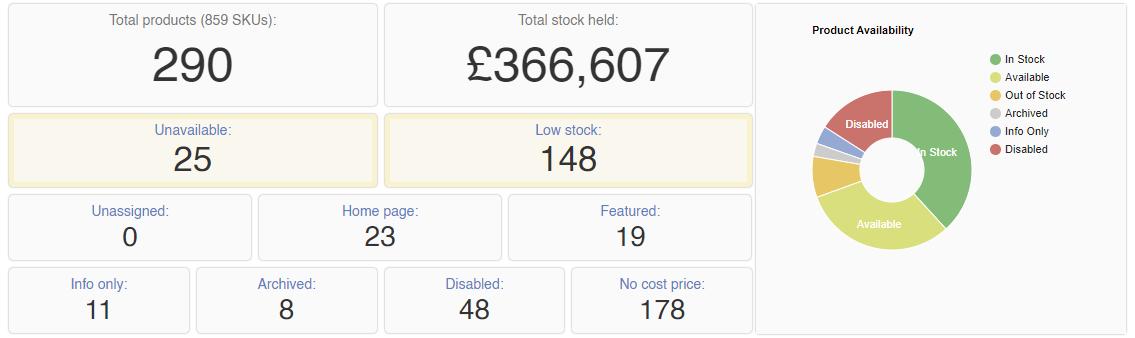
Displays if the user is enabled for 
This can be used to get a snapshot of your Products; it will also provide you with pre-filtered links to allow swift management of Products.
Purchase Orders

Displays if the user is enabled for 
This will display essential information about your Purchase Orders, along with quick links for immediate action as required.
Recent Best Sellers
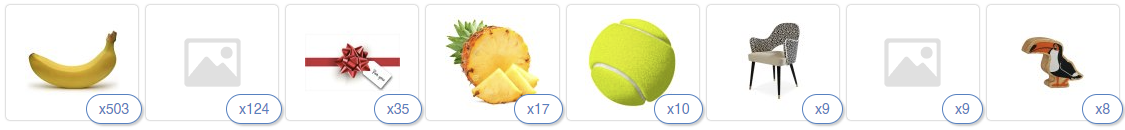
Displays if the user is enabled for
Displays your recent Best Sellers.
Returns

Displays if the user is enabled for 
This will display essential information about your Returns, along with quick links for immediate action as required.
Sales (Weekly/Monthly/Yearly)
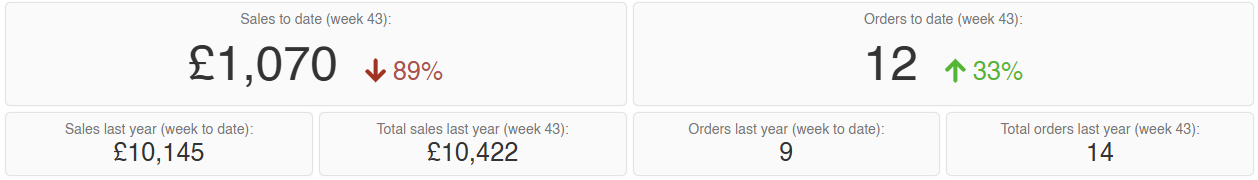
Displays if the user is enabled for
Tasks

Displays if the user is enabled for 
This will show the total number of outstanding Tasks both companywide and for the current user, along with filtered click throughs.
Today

Displays if the user is enabled for
This will show the total value and number of sales across the whole system today.
How to Reset the Dashboard
The dashboard can be reset quickly using the following steps.
1. Navigate to your CMS.
2. Click the "Dashboard" icon in the navigation bar.
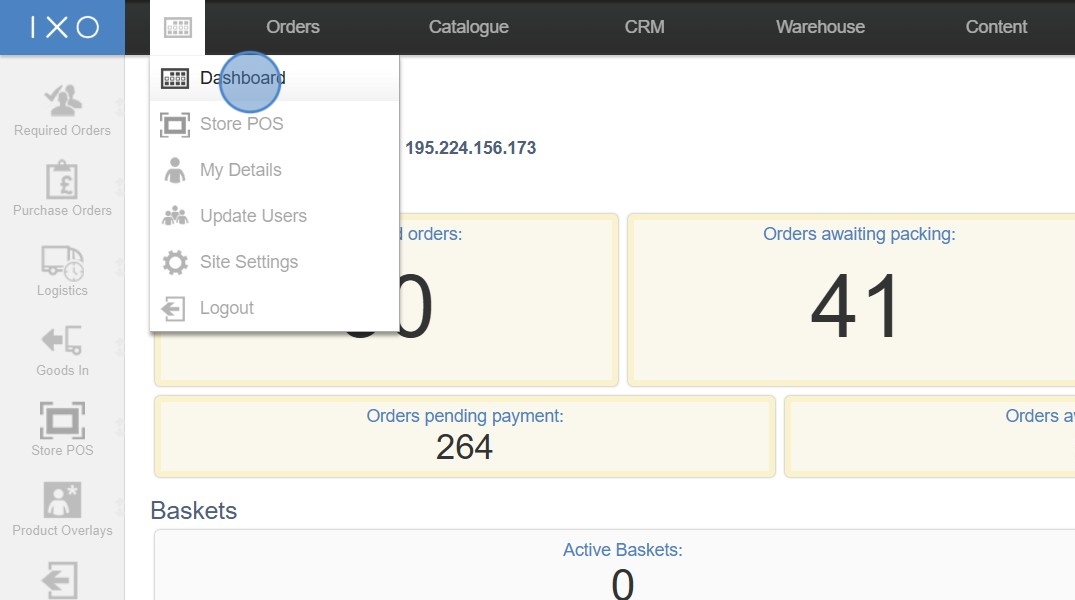
3. Scroll to the very bottom of the page and click "Reset dashboard layout".

How to Rearrange the Dashboard
The dashboard utilises a simple drag and drop system to rearrange tiles on the dashboard screen. Moving a tile will pin it in position without the need to save, and you can rearrange all tiles to suit your needs.


