Other Reports
FAQs
General
Are Reports sortable?
All reports are sortable - simply click on the headers.
Can a report be exported?
All reports are exportable as a CSV.
Why are some results 'N/A' or simply blank?
This will be due to missing information, e.g. products that are sold which have not been assigned to a Department, or to a Brand with a blank entry in the name.
Real Time Data
Are the reports up to date?
All reports show a snapshot of data at the instant that they were generated. As such, they are always up to date.
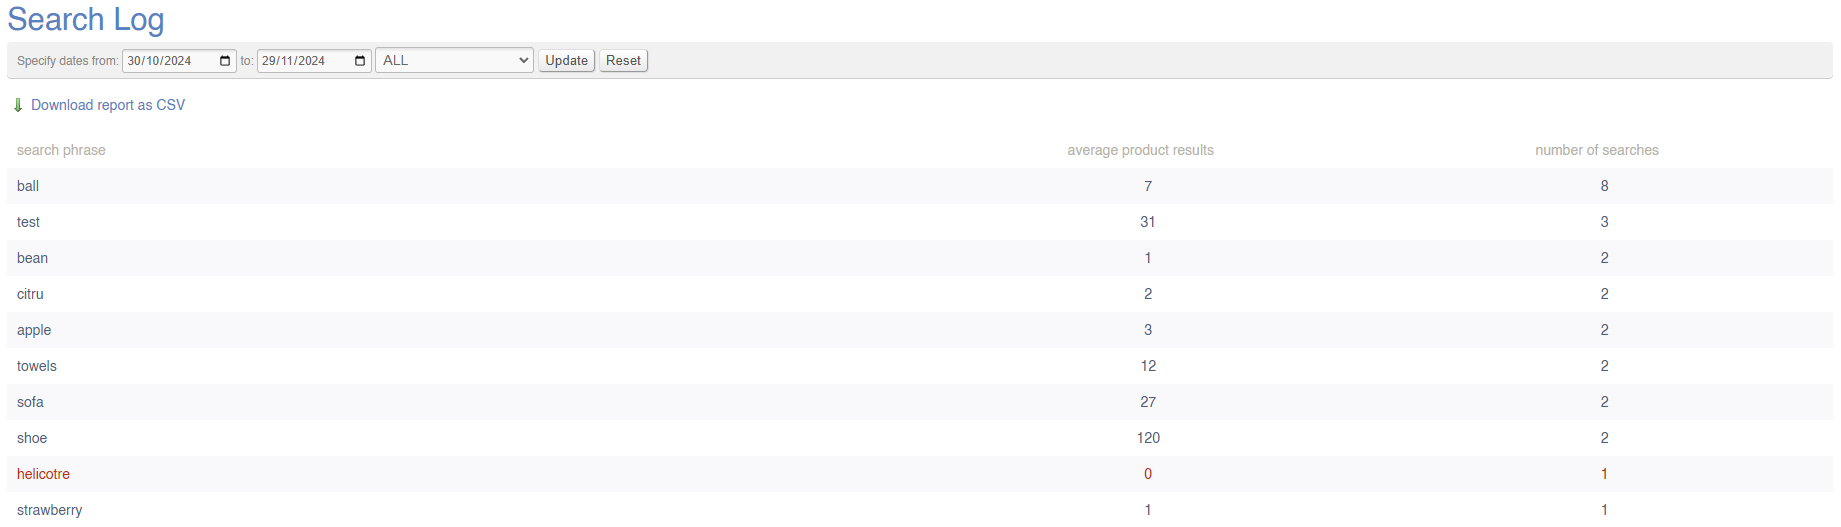
Search Log
This report will show you Site Searches made within a given period.
Unsuccessful searches are highlighted in red.
This report is intended to be used in conjunction with Search Overrides to make the most of your popular searches, correct typos and mitigate unsuccessful searches
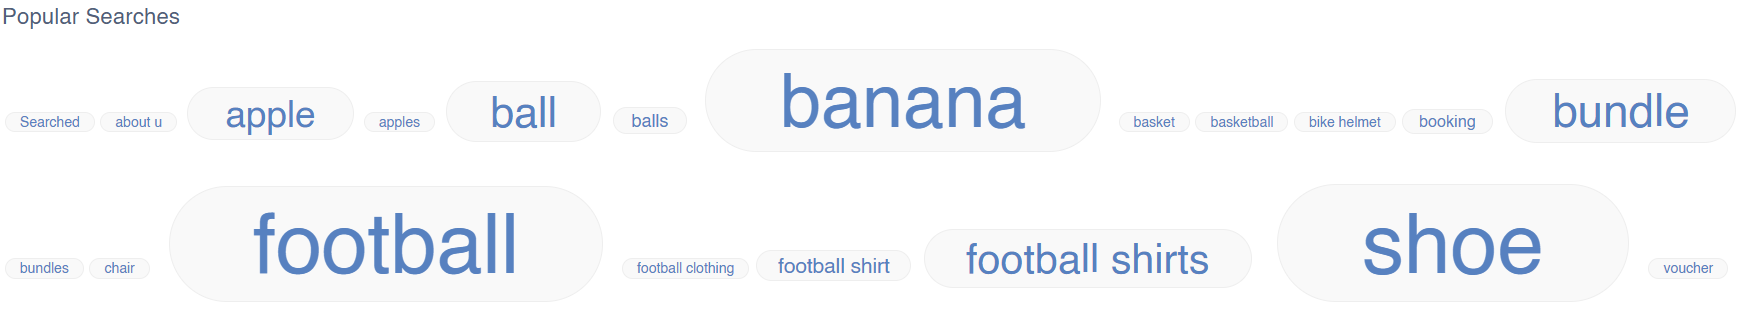
On page load, it will show a word cloud of popular searches:
Filters
This report may be filtered by:
- Date Range
- All/Successful/Unsuccessful Searches
Key to icons
![]() = download report
= download report
FAQs
FAQs for Log Reports may be viewed here.
Price History
This report will show all price changes within a given period that have been viewed by a Customer. It may be searched by SKU code.
This will only show Price Changes that have been viewed by a Customer, e.g. when a Product is viewed in the POS, on your website, or when the item is added to a Sales Order.
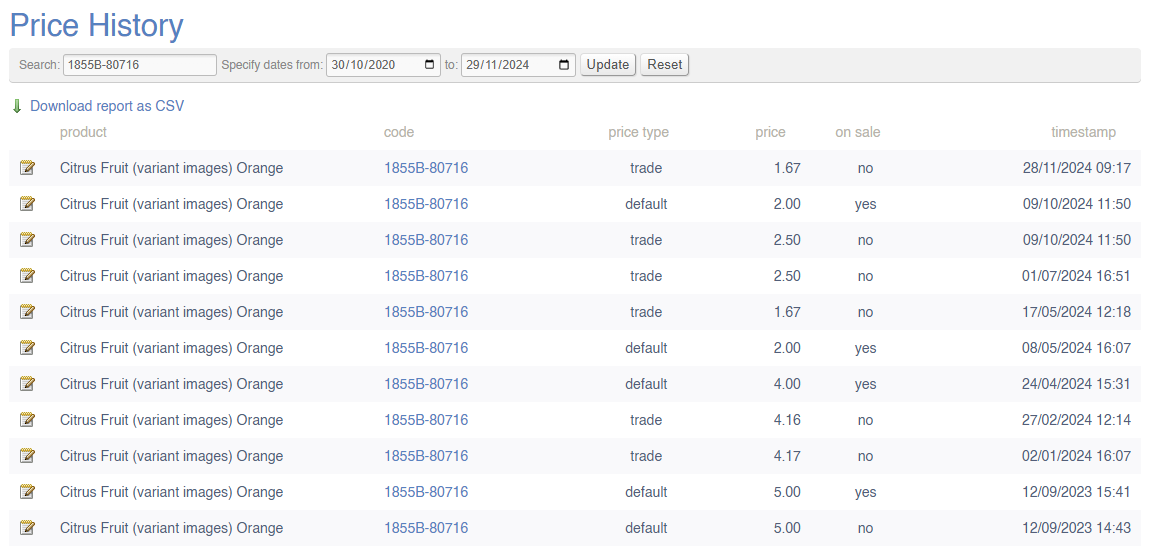
Filters
This report may be filtered by:
- SKU
- Date Range
Key to icons
![]() = download report
= download report
FAQs
FAQs for Log Reports may be viewed here.
Admin Activity Log
This report will keeps a log of user activity within the CMS. It will show you who has logged in and what they have changed.
It is not possible to undo changes that have been made - this report is solely for indicative purposes
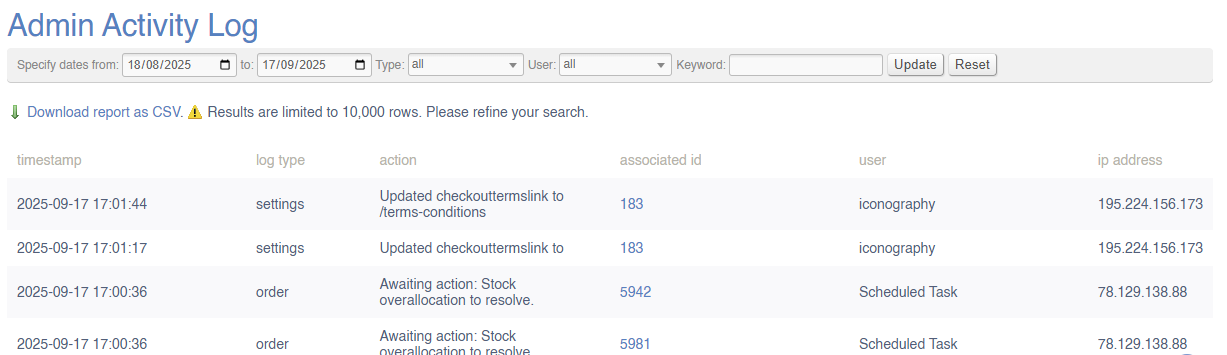
Data is held on all activity within the CMS, from logging into the system up to amending pages, products and more. IXO Commerce logs activity, but does not record the previous figure in most instances. If a user changes a product name from 'Nike Running Shoe' to 'Running Shoe', the change would be recorded, but neither the precise field nor the historical value would be recorded.

More granular information is recorded against certain actions. These include, but are not limited to:
- Sales Order management
- Purchase Order management
More granular information relating to stock and prices are to be found on the Price History and Stock History reports respectively.
Filters
This report may be filtered by:
- Date Range
- Type
- User
- Keyword (e.g. partial text match for 'action' column)
Key to icons
![]() = download report
= download report
FAQs
FAQs for Log Reports may be viewed here.
Timed Pricing
This screen will show all queued price changes that have been added via the Price Management screen.
It is not possible to edit price changes once they have been added, merely cancel them
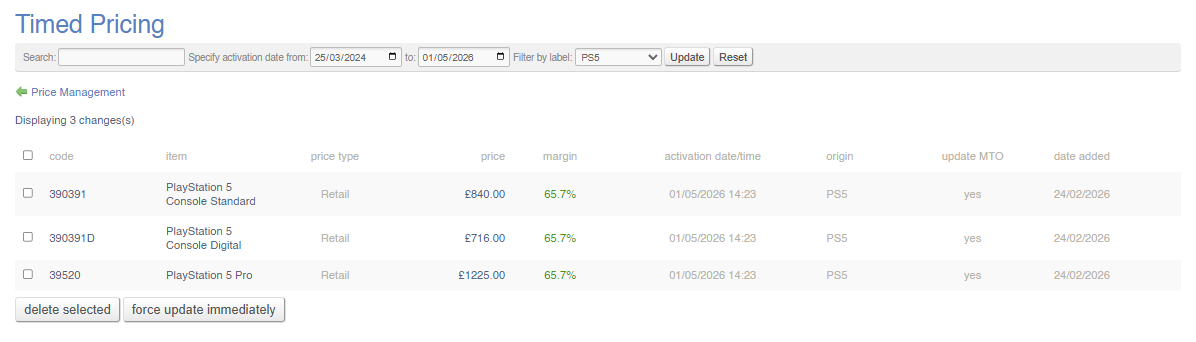
Use the tick boxes on the left to select Timed Pricing changes to cancel.
Filters
This report may be filtered by:
- Search (by SKU or Product Name)
- Date Range
- Label (choose from drop down)
Actions
You may select price changes in bulk and either:
- delete them
- force update immediately (overrides the schedule and activates the price immediately)
FAQs
FAQs for Log Reports may be viewed here.
Notes by User
This report shows a summary of notes by User.
This is a summary of the Tasks within the CRM.
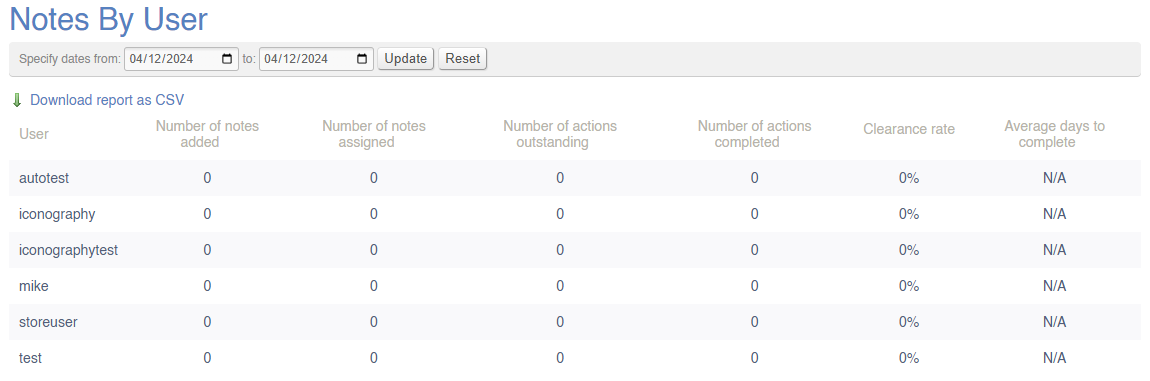
Filters
This report may be filtered by:
- Date Range
Key to icons
![]() = download report
= download report
FAQs
FAQs for Log Reports may be viewed here.
Performance by User
This report will show a breakdown of company-wide sales within a given period; the value of sales will be split by User (Salesperson). This list is based on the data you have set up in the Update Users menu. This report can also be used to calculate commission.
Sales Orders can each be attributed to a single Salesperson. This can be edited within the Sales Order management screen.
Sales Orders without a Salesperson will be omitted from this report.
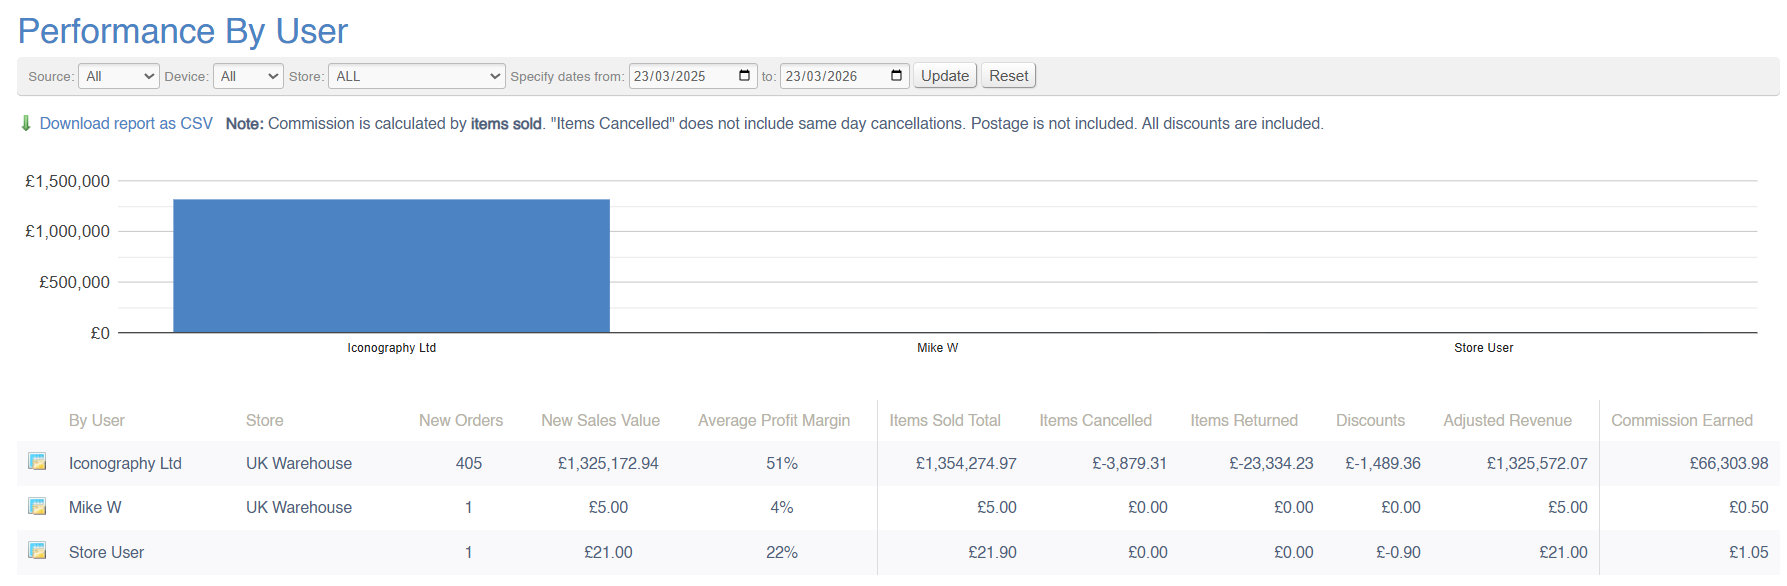
Data Explanation
This report is split into two sections; 'sales data' and 'adjusted sales data'
Sales Data
This section of the report performs exactly like a standard Sales Report (see 'what is a sale'?). This includes:
| Field | Purpose |
| New Orders | Total number of new sales orders, e.g. sales orders created within the selected date range |
| New Sales Value | Total value of those new sales orders, e.g. sales orders created within the selected date range |
| Average profit margin | Average margin on those new sales orders, e.g. sales orders created within the selected date range |
Adjusted Total
These figures to the right of the first dividing line are adjusted figures; that means that they have been adjusted to take into account changes on a line by line basis. Rather than reflecting the Sales Order date, these figures reflect the date against the Sales Order line.
For example, a £1000 widget is sold on the 1st of May, creating a new Sales Order. On the 1st June, a second widget is added for £1000. The total value of that Sales Order is £2000, but it would only show as a new Sales Order on a report run on May's sales figures. If the report were run for June, the second widget would be included under 'items sold total'.
| Field | Purpose |
| Items sold total |
Total value of items sold within the period, based on 'date added' as stored against each Sales Order line
This is not based on the sales date of the Sales Order |
| Items cancelled | Total value of items cancelled against Sales Order where 'date cancelled' (stored against the Sales Order line) is within the selected date range |
| Items returned | Total value of items returned against Sales Order where 'date returned' (stored against the Sales Order line) is within the selected date range |
| Discounts | Total value of discounts on Sales Order lines where 'date added' (stored against the Sales Order line) is within the selected date range |
| Adjusted Revenue | The sum of the preceding columns |
Commission
This column shows the commission due to each Sales Person.
Please ensure that you have spoken to Iconography to setup your commission rules
Commission is calculated user the commission rate set against each user in the Update Users screen:
1. As a percentage of the value of items sold
The commission for this period will be calculated as a percentage of the total value of items sold during the specified timeframe. However, deductions will be applied for any items that were either returned or cancelled within the same period. These deductions will be based on the data reflected in the 'Cancelled' and 'Returns' columns of the report. The final commission amount will be adjusted accordingly to ensure it reflects only completed and successful sales.
The report will be adjusted appropriately for items returned/cancelled during that time period for all orders, regardless of when they are placed.
2. As a percentage of the value of items delivered
The commission for this period will be calculated as a percentage of the total value of items delivered during the specified timeframe, based on the delivery date. Deductions will be made for any items that were returned within the same period, as indicated in the 'Returns' column of the report. The final commission amount will be adjusted to reflect only those sales where the items were successfully delivered and not returned.
The report will be adjusted appropriately for items returned during that time period for all orders, regardless of when they are placed.
3. As a percentage of the value of payments
The report will be adjusted appropriately for refunds during that time period for all orders, regardless of when they are placed.
Returns, Refunds, Cancellations and Clawbacks
Sales Data:
Filters
This report may be filtered by:
- Source
- Device
- Store
- Date Range
Key to icons
 = view sales from this User in the Sales by Category report (matching any other filters applied)
![]() = download report
= download report
For more information on margin calculation, click here
FAQs
FAQs for Sales Reports may be viewed here.