# Sales Reports
# FAQs
## Sales and Revenue
### What is a 'Sale'?
The Sales Reports report on revenue generated on a specific date. Revenue is defined as the total value of an order, including all Products, Addons, Discounts and Delivery.
Revenue is separate to payments, which are reported on separately under Payment Reports.
### Which Orders and Order Lines will form part of revenue reporting?
Orders with the following statuses are excluded from revenue reporting:
- Draft
- Quote
- Abandoned
In addition, Order Lines with the following statuses are ignored (as they value will have been set to £0.00)
- Cancelled
- Returned
## Real Time Data
### Are the reports up to date?
All reports show a snapshot of data at the instant that they were generated. As such, they are always up to date.
### The value of a Sales Order has changed; how will this be reflected in the reporting?
With the exception of [Performance by User](https://bookstack.iconography.co.uk/books/other-reports/page/performance-by-user "Performance by User"), all revenue reporting is done based on the Sales Order date. That means that a Sales Order that has a date of the 1st of October will always report its revenue as the 1st of October, even if new lines are added on the 1st November.
### The Salesperson on a Sales Order has changed; how will this be reflected in the reporting?
This will immediately update and change all reports. This will adjust how reports are filtered, and will also have a direct impact on the [Performance by User](https://bookstack.iconography.co.uk/books/other-reports/page/performance-by-user "Performance by User") report.
### The Store on a Sales Order has changed; how will this be reflected in the reporting?
This will immediately update and change all reports. This will adjust how reports are filtered, and will also have a direct impact on the Sales by Channel report.
### What happens if a Product is deleted?
Some information is stored against the Sales Order, and IXO Commerce will report on that; other data is stored only against the product. This is done via a lookup of the product, and if that product has been deleted then it will not be possible to report on that data.
Stored against the Sales Order
- Sales Date
- Store
- User
- Source
- Payments
- Selling Price
- Cost Price
- Product Name
- Product SKU
Stored against the Product
- Brand Associations
- Category Associations
- Collection Associations
- Supplier Associations
#### Example
A product is sold in May for £10 at a cost price of £5. That product was a Lego Boat, associated with the Lego Brand.
If that product is deleted, then the association with the Lego Brand will also be deleted. This means that while the selling price and cost price are still reportable (as data that is held against the sales order), that order line will no longer be associated with the Lego Brand.
This will mean that this order line will not be included if the user filters a report by Brand, and if they view the Sales by Brand report, it would add to the 'n/a' row.
## Average Cost Prices and Profit Margins
### What is an 'Average Cost Price' and how is it calculated?
An Average Cost Price represents the mean cost of all items sold within a specific period. It’s calculated by dividing the total cost of all products sold by the total number of units sold. This metric helps businesses understand the average expense of acquiring or producing the goods they’ve sold, allowing for better profitability analysis.
Depending on the report, this might be done per SKU ([Sell Through](https://bookstack.iconography.co.uk/books/sales-reports/page/sell-through "Sell Through") report), or it might provide an Average Cost Price by Brand ([Sales by Brand](https://bookstack.iconography.co.uk/books/sales-reports/page/sales-by-brand "Sales by Brand")), or Department ([Sales by Department](https://bookstack.iconography.co.uk/books/sales-reports/page/sales-by-department "Sales by Department")), etc.
#### Example
Suppose you have a **Sales by Brand report** for the brand **"Brand A"** covering the period **from January 1 to January 31**.
Within this time frame, the following sales occurred:
| **Product** | **Quantity Sold** | **Cost Price per Unit** |
| Product 1 | 10 | £5.00 |
| Product 2 | 20 | £7.00 |
| Product 3 | 15 | £6.50 |
To calculate the **Average Cost Price** for **Brand A** during January:
1. **Sum up the Cost Prices**:
- Product 1: 10 units × £5.00 = £50.00
- Product 2: 20 units × £7.00 = £140.00
- Product 3: 15 units × £6.50 = £97.50
2. **Total Cost Price**: £50.00 + £140.00 + £97.50 = **£287.50**
3. **Total Quantity Sold**: 10 + 20 + 15 = **45 units**
4. **Calculate the Average Cost Price**:
- £287.50 ÷ 45 units = **£6.39** (rounded to 2 decimal places)
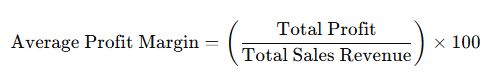
### What is an 'Average Profit Margin' and how is it calculated?
An Average Profit Margin measures the percentage of profit a business earns on its sales after accounting for costs. Depending on the report, this might be done per SKU ([Sell Through](https://bookstack.iconography.co.uk/books/sales-reports/page/sell-through "Sell Through") report), or it might provide an Average Cost Price by Brand ([Sales by Brand](https://bookstack.iconography.co.uk/books/sales-reports/page/sales-by-brand "Sales by Brand")), or Department ([Sales by Department](https://bookstack.iconography.co.uk/books/sales-reports/page/sales-by-department "Sales by Department")), etc.
#### Example
An Average Profit Margin on the Sales by Brand report will look for all sales of Products assigned to that Brand that took place within the specified period. It will then total the cost price of those items and compare it to the total sales revenue to produce an Average Profit Margin using the below formula (please note that all margins are calculated net of VAT):
[](https://bookstack.iconography.co.uk/uploads/images/gallery/2024-11/q6Jimage.png)
**Period:** February 1 - February 28
| **Product** | **Quantity Sold** | **Cost Price per Unit** | **Selling Price per Unit** |
| Product 4 | 30 | £4.00 | £6.00 |
| Product 5 | 25 | £10.00 | £15.00 |
| Product 6 | 10 | £20.00 | £30.00 |
1. **Calculate the Total Sales Revenue**:
- Product 4: 30 × £6.00 = £180.00 = £150.00 ex VAT
- Product 5: 25 × £15.00 = £375.00 = £312.50 ex VAT
- Product 6: 10 × £30.00 = £300.00 = £250.00 ex VAT
**Total Sales Revenue** = £180.00 + £375.00 + £300.00 = £855.00 = **£712.50 ex VAT**
2. **Calculate the Total Cost**:
- Product 4: 30 × £4.00 = £120.00
- Product 5: 25 × £10.00 = £250.00
- Product 6: 10 × £20.00 = £200.00
**Total Cost** = £120.00 + £250.00 + £200.00 = **£570.00**
3. **Calculate the Profit**:
- Profit = £712.50 - £570.00 = **£142.50**
4. **Calculate the Average Profit Margin**:
[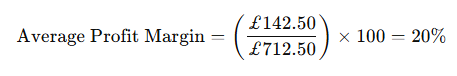](https://bookstack.iconography.co.uk/uploads/images/gallery/2024-11/nRBimage.png)
### Why do some reports say 'Unknown' (e.g. Average Cost Price and Profit Margin)?
This will be because IXO Commerce is missing data - nothing is recorded against Sales Orders for cost price. Without a cost price, it is not possible to calculate Average Cost Price or Profit Margin.
## General
### Are Reports sortable?
All reports are sortable - simply click on the headers.
### Can a report be exported?
All reports are exportable as a CSV.
### Why are some results 'N/A' or simply blank?
This will be due to missing information, e.g. products that are sold which have not been assigned to a Department, or to a Brand with a blank entry in the name.
# Sales by Date
This report will show a breakdown of company-wide sales within a given period.
Data may be viewed by:
- Day
- Week
- Month
[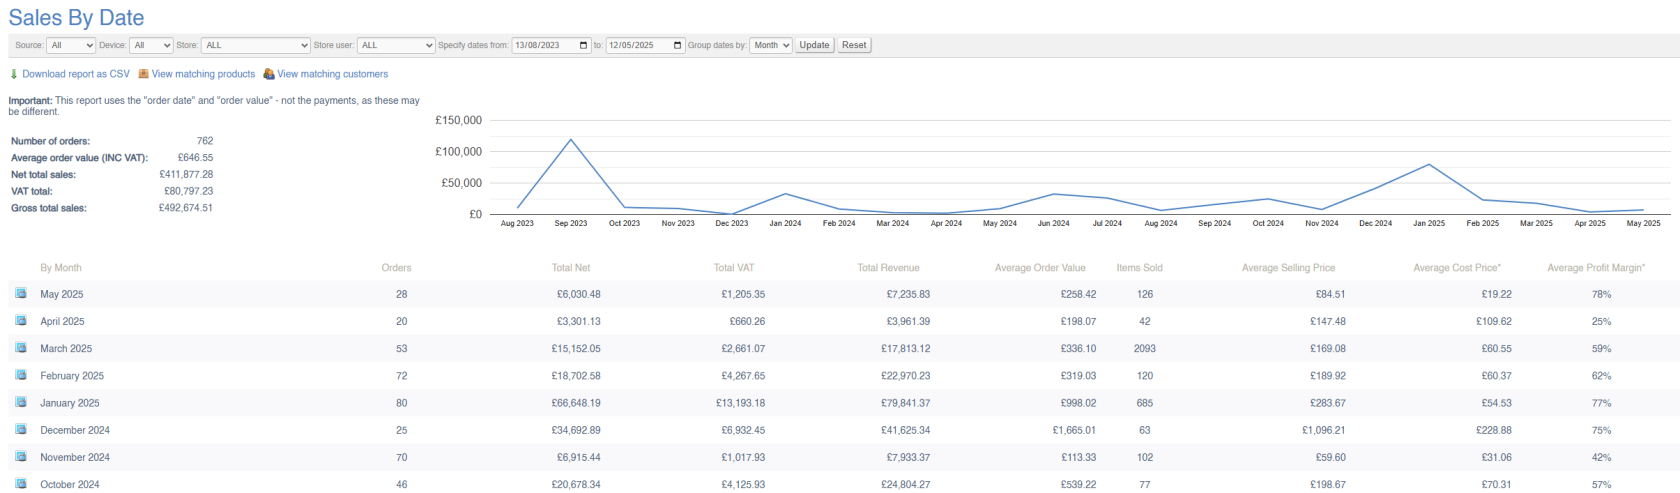](https://bookstack.iconography.co.uk/uploads/images/gallery/2025-09/1oqimage.png)
#### Filters
This report may be filtered by:
- Date Range
- Store
- Store User
- Source
- Device
- Category
- Brand
- Collection
- Supplier
#### Key to icons
 = view day/week/month broken down to [Sales by Channel](https://bookstack.iconography.co.uk/books/sales-reports/page/sales-by-channel "Sales by Channel") (and matching any other filters applied)
 = download report
 = view matching products (products sold within this date range and matching any other filters applied)
 = view matching customers (customers who completed a purchase within this date range and matching any other filters applied)
### FAQs
FAQs for Sales Reports may be viewed [here](https://bookstack.iconography.co.uk/books/sales-reports/page/faqs "FAQs").
# Sales by Channel
This report will show a breakdown of company-wide sales within a given period.
The data will be broken down by Channel, wither separate rows for:
- Each Store
- eCommerce website(s)
- Phone
- Alternative Channels (e.g. [Amazon](https://bookstack.iconography.co.uk/books/integrations/page/amazon "Amazon"), [eBay](https://bookstack.iconography.co.uk/books/integrations/page/ebay "eBay"), etc.)
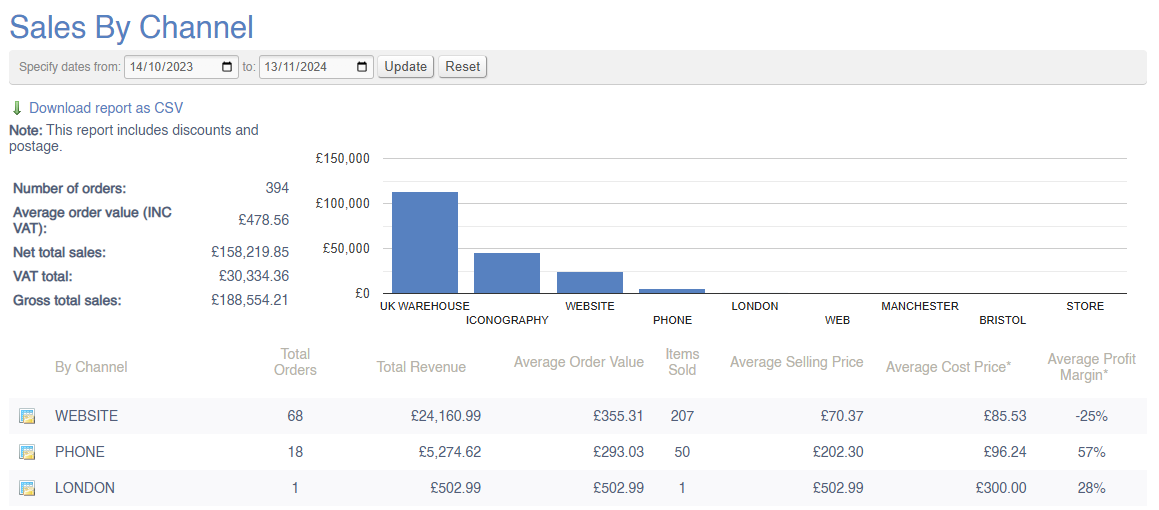
#### Filters
This report may be filtered by:
- Date Range
#### Key to icons
 = view [Sales by Category](https://bookstack.iconography.co.uk/books/sales-reports/page/sales-by-category "Sales by Category") for this date range, filtered to this Channel
 = download report
For more information on margin calculation, click [here](https://bookstack.iconography.co.uk/books/general/page/margin-calculation)
### FAQs
FAQs for Sales Reports may be viewed [here](https://bookstack.iconography.co.uk/books/sales-reports/page/faqs "FAQs").
# Sales by Category
This report will show a breakdown of company-wide sales within a given period; the value of sales will be split by Category. This list is based on the categories you have set up in the [Catalogue](https://bookstack.iconography.co.uk/books/categories/page/summary-UWK "Summary").
[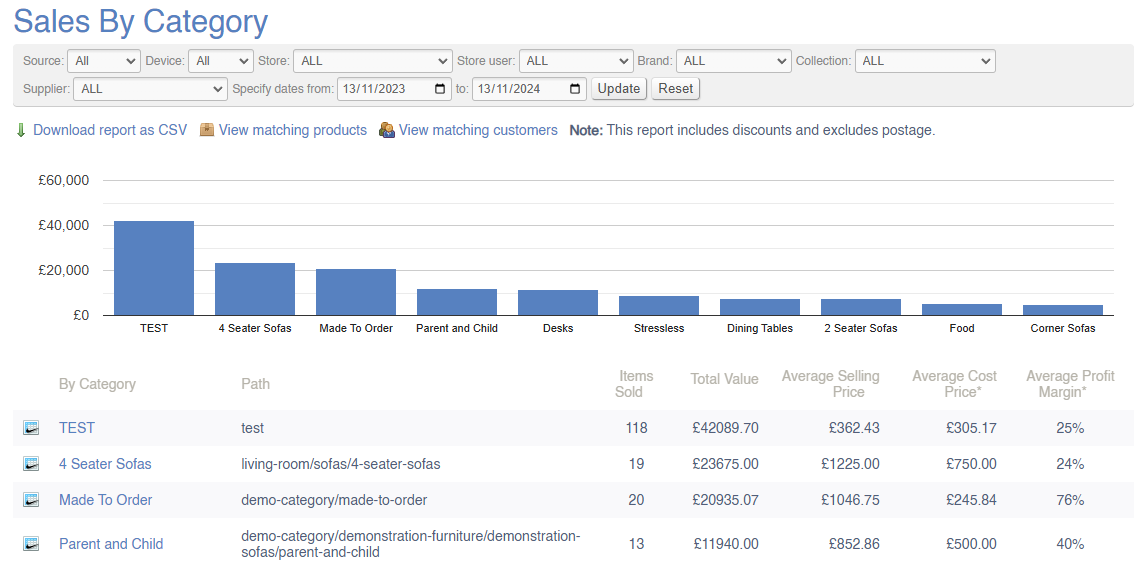](https://bookstack.iconography.co.uk/uploads/images/gallery/2024-11/HLiimage.png)
#### Filters
This report may be filtered by:
- Source
- Device
- Store
- Store User
- Brand
- Collection
- Supplier
- Date Range
#### Key to icons
[](https://bookstack.iconography.co.uk/uploads/images/gallery/2024-11/0Ksimage.png) = view sales from this Category in the [Sales by Brand](https://bookstack.iconography.co.uk/books/sales-reports/page/sales-by-brand "Sales by Channel") report (matching any other filters applied)
 = download report
 = view matching products (products sold within this date range and matching any other filters applied)
 = view matching customers (customers who completed a purchase within this date range and matching any other filters applied)
For more information on margin calculation, click [here](https://bookstack.iconography.co.uk/books/general/page/margin-calculation)
### FAQs
FAQs for Sales Reports may be viewed [here](https://bookstack.iconography.co.uk/books/sales-reports/page/faqs "FAQs").
# Sales by Brand
This report will show a breakdown of company-wide sales within a given period; the value of sales will be split by Brand. This list is based on the data you have set up in the [Brands](https://bookstack.iconography.co.uk/books/brands "Brands") menu.
[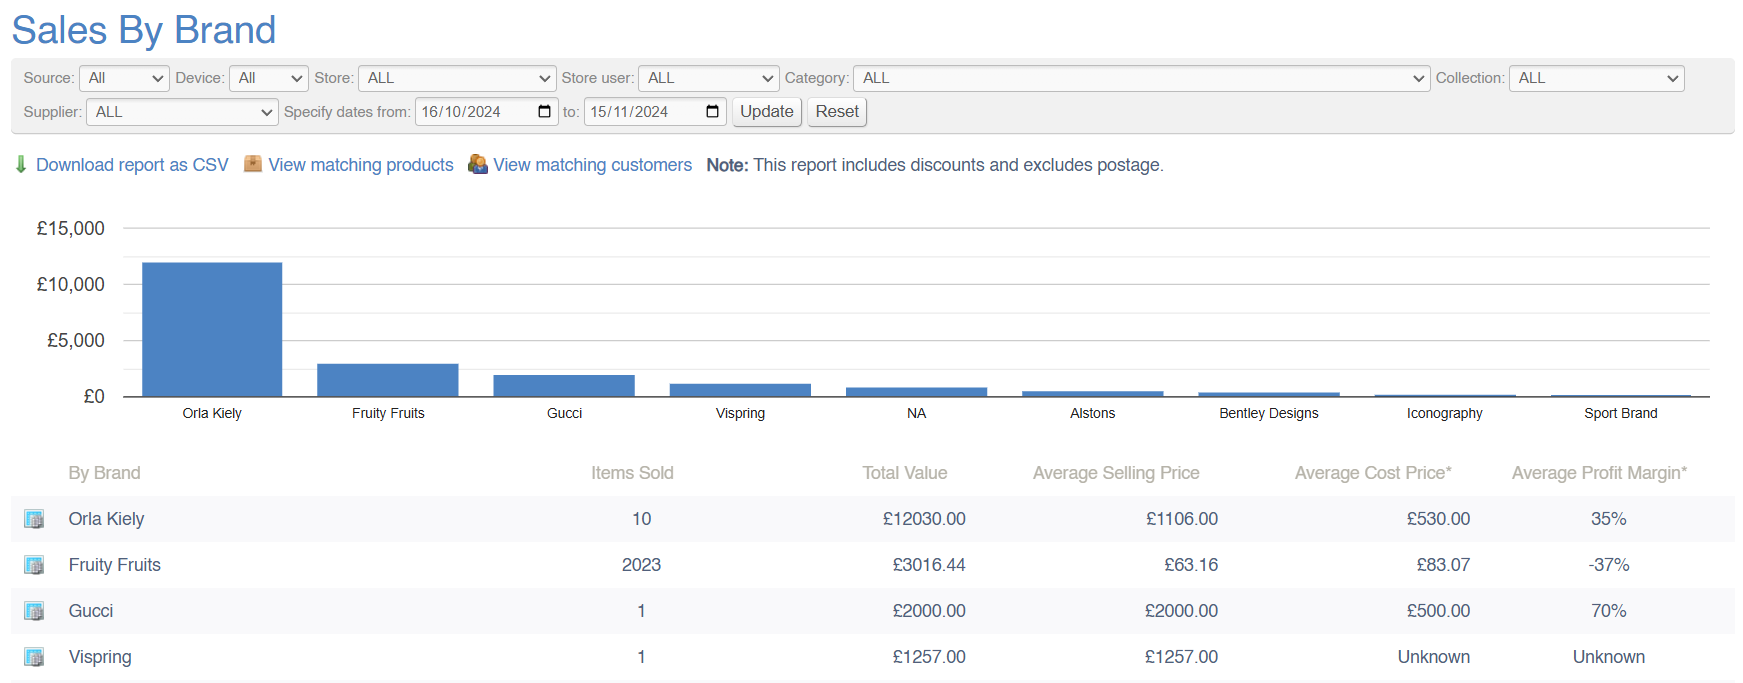](https://bookstack.iconography.co.uk/uploads/images/gallery/2024-11/RNNimage.png)
#### Filters
This report may be filtered by:
- Source
- Device
- Store
- Store User
- Category
- Collection
- Supplier
- Date Range
#### Key to icons
[](https://bookstack.iconography.co.uk/uploads/images/gallery/2024-11/tYOimage.png) = view sales from this Brand in the [Sales by Collection](https://bookstack.iconography.co.uk/books/sales-reports/page/sales-by-collection "Sales by Channel") report (matching any other filters applied)
 = download report
 = view matching products (products sold within this date range and matching any other filters applied)
 = view matching customers (customers who completed a purchase within this date range and matching any other filters applied)
For more information on margin calculation, click [here](https://bookstack.iconography.co.uk/books/general/page/margin-calculation)
### FAQs
FAQs for Sales Reports may be viewed [here](https://bookstack.iconography.co.uk/books/sales-reports/page/faqs "FAQs").
# Sales by Collection
This report will show a breakdown of company-wide sales within a given period; the value of sales will be split by Collection. This list is based on the data you have set up in the [Collections](https://bookstack.iconography.co.uk/books/collections "Collections") menu.
[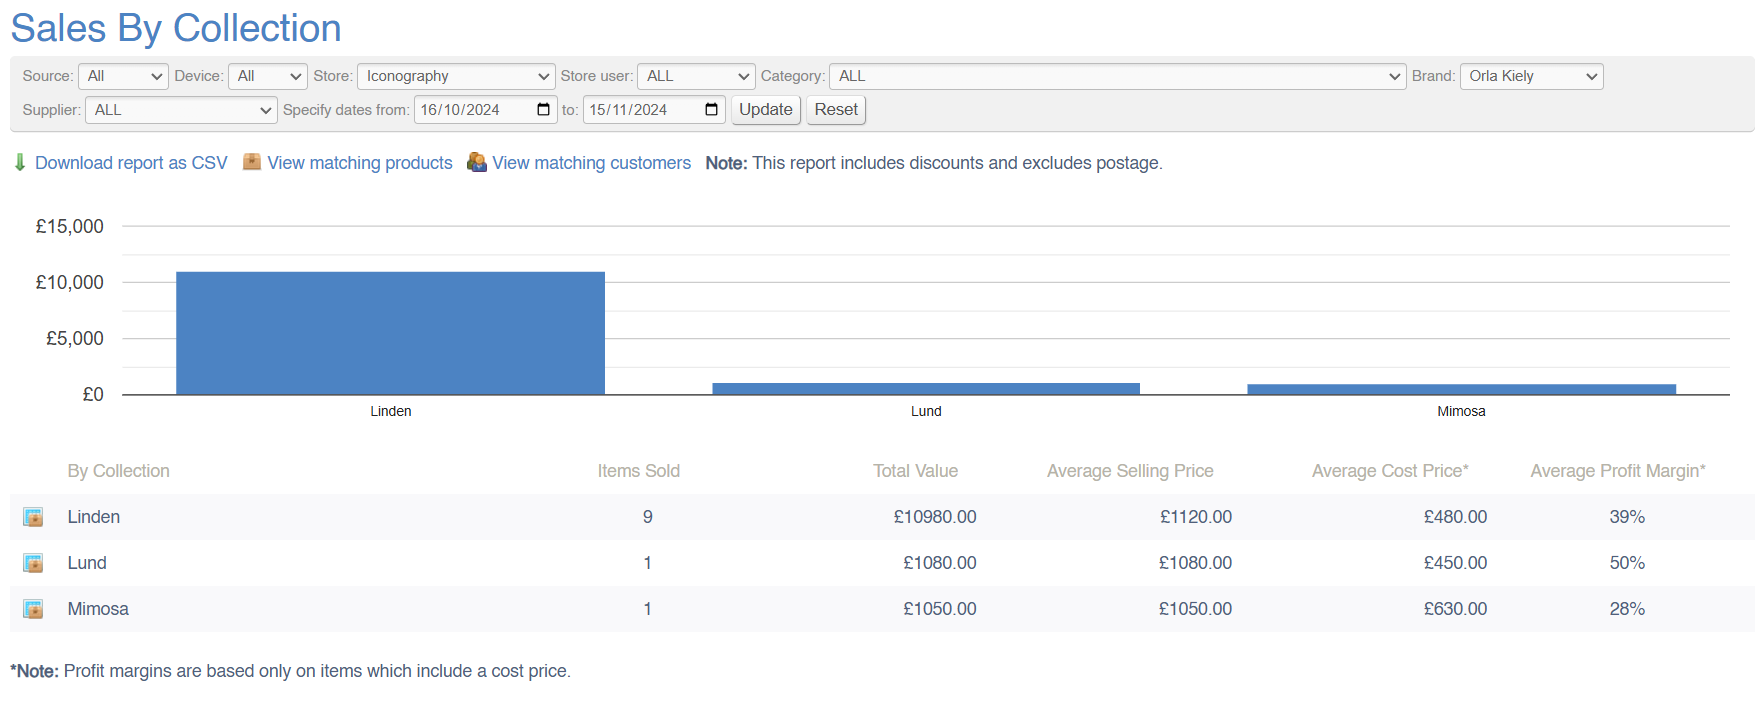](https://bookstack.iconography.co.uk/uploads/images/gallery/2024-11/Nw9image.png)
#### Filters
This report may be filtered by:
- Source
- Device
- Store
- Store User
- Category
- Brand
- Supplier
- Date Range
#### Key to icons
[](https://bookstack.iconography.co.uk/uploads/images/gallery/2024-11/KEOimage.png) = view sales from this Collection in the [Sell Through](https://bookstack.iconography.co.uk/books/sales-reports/page/sell-through "Sell Through") report (matching any other filters applied)
 = download report
 = view matching products (products sold within this date range and matching any other filters applied)
 = view matching customers (customers who completed a purchase within this date range and matching any other filters applied)
For more information on margin calculation, click [here](https://bookstack.iconography.co.uk/books/general/page/margin-calculation)
### FAQs
FAQs for Sales Reports may be viewed [here](https://bookstack.iconography.co.uk/books/sales-reports/page/faqs "FAQs").
# Sales by Supplier
This report will show a breakdown of company-wide sales within a given period; the value of sales will be split by Supplier. This list is based on the data you have set up in the [Supplier](https://bookstack.iconography.co.uk/books/suppliers "Suppliers") menu.
[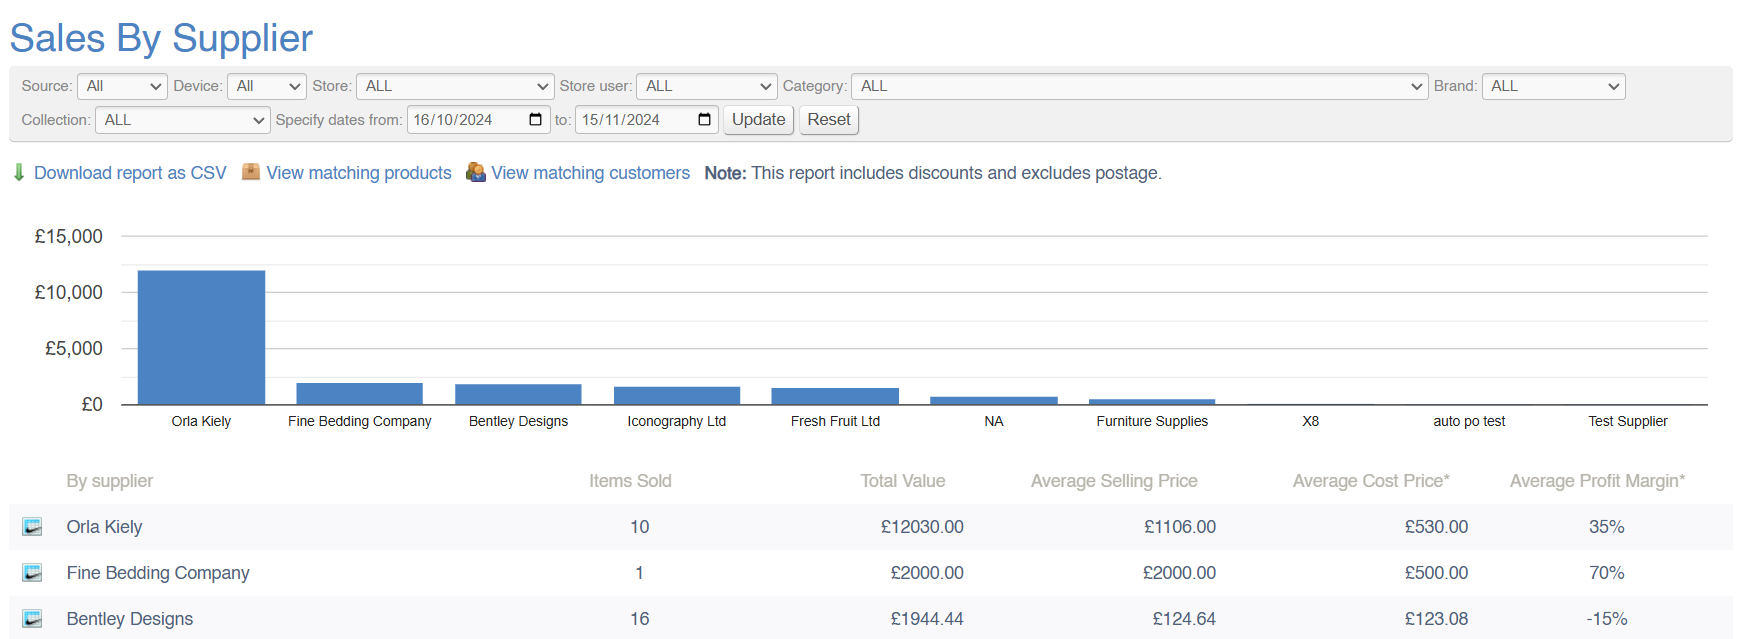](https://bookstack.iconography.co.uk/uploads/images/gallery/2024-11/nVNimage.png)
#### Filters
This report may be filtered by:
- Source
- Device
- Store
- Store User
- Category
- Collection
- Brand
- Date Range
#### Key to icons
[](https://bookstack.iconography.co.uk/uploads/images/gallery/2024-11/GJeimage.png) = view sales from this Supplier in the [Sales by Brand](https://bookstack.iconography.co.uk/books/sales-reports/page/sales-by-brand "Sales by Brand") report (matching any other filters applied)
 = download report
 = view matching products (products sold within this date range and matching any other filters applied)
 = view matching customers (customers who completed a purchase within this date range and matching any other filters applied)
For more information on margin calculation, click [here](https://bookstack.iconography.co.uk/books/general/page/margin-calculation)
### FAQs
FAQs for Sales Reports may be viewed [here](https://bookstack.iconography.co.uk/books/sales-reports/page/faqs "FAQs").
# Sales by Campaign
This report will show a breakdown of company-wide sales within a given period; the value of sales will be split by Campaign. A Campaign may be defined as:
- Referral links, e.g. Google Ads and affiliates (Referral links should include "utm\_source" and "utm\_campaign" parameters)
- Newsletter emails (Referral links should include "utm\_source" and "utm\_campaign" parameters)
- Automated site emails, e.g. back-in-stock or your-account-password
- 'How did you find us' recorded against each customer
'Campaign' is limited to 50 characters
[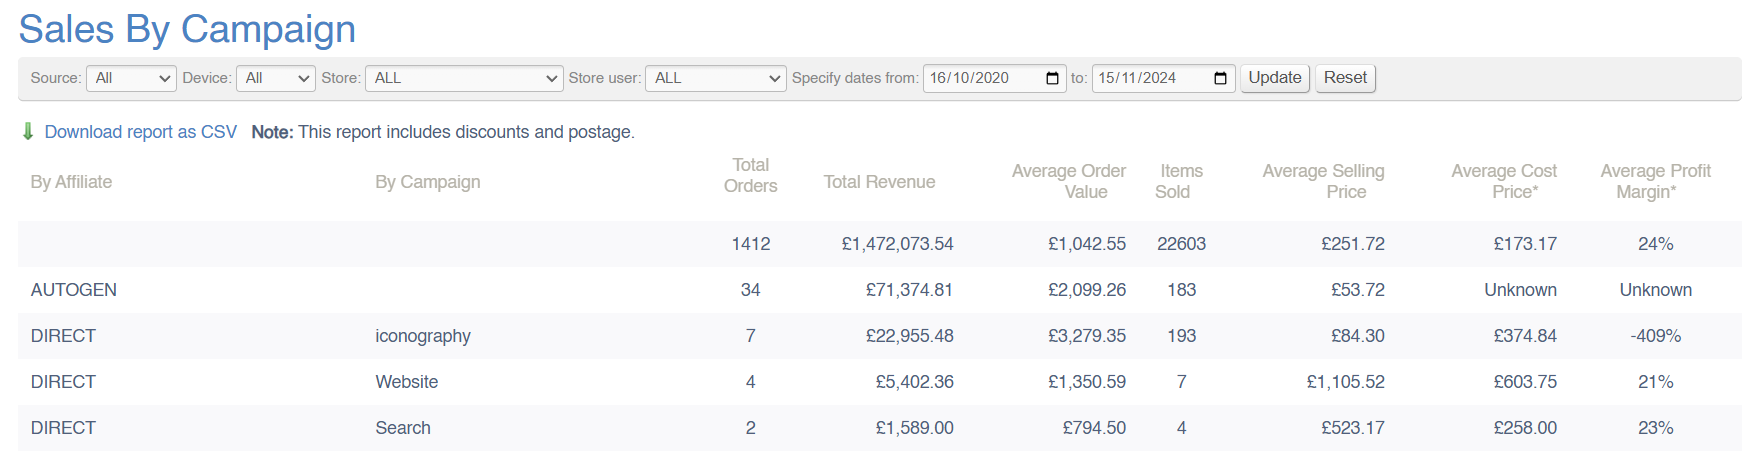](https://bookstack.iconography.co.uk/uploads/images/gallery/2024-11/QtPimage.png)
#### Filters
This report may be filtered by:
- Source
- Device
- Store
- Store User
#### Key to icons
 = download report
### FAQs
FAQs for Sales Reports may be viewed [here](https://bookstack.iconography.co.uk/books/sales-reports/page/faqs "FAQs").
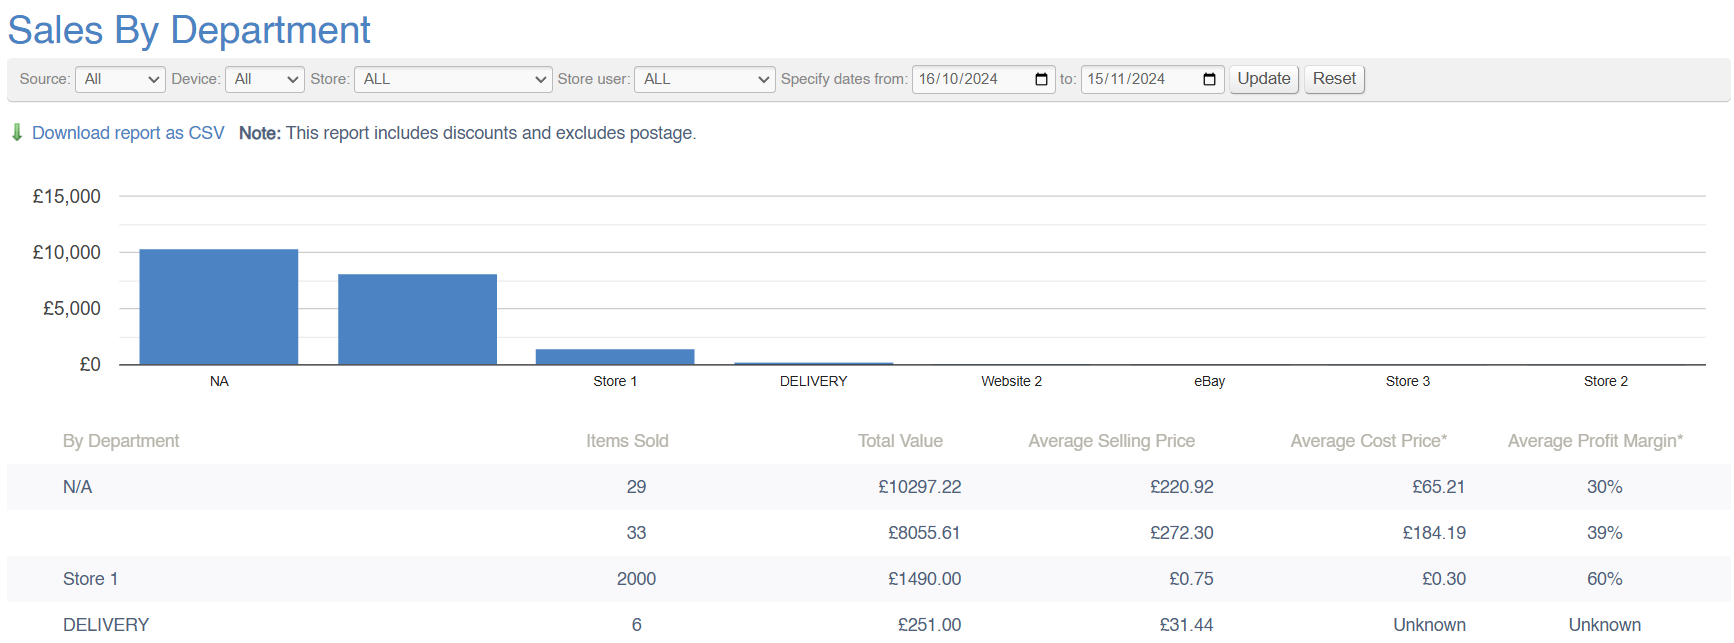
# Sales by Department
This report will show a breakdown of company-wide sales within a given period; the value of sales will be split by Department. This list is based on the departments you have set up against [Products](https://bookstack.iconography.co.uk/books/categories/page/product "Product").
[](https://bookstack.iconography.co.uk/uploads/images/gallery/2024-11/PBBimage.png)
#### Filters
This report may be filtered by:
- Source
- Device
- Store
- Store User
- Date Range
#### Key to icons
 = download report
For more information on margin calculation, click [here](https://bookstack.iconography.co.uk/books/general/page/margin-calculation)
### FAQs
FAQs for Sales Reports may be viewed [here](https://bookstack.iconography.co.uk/books/sales-reports/page/faqs "FAQs").
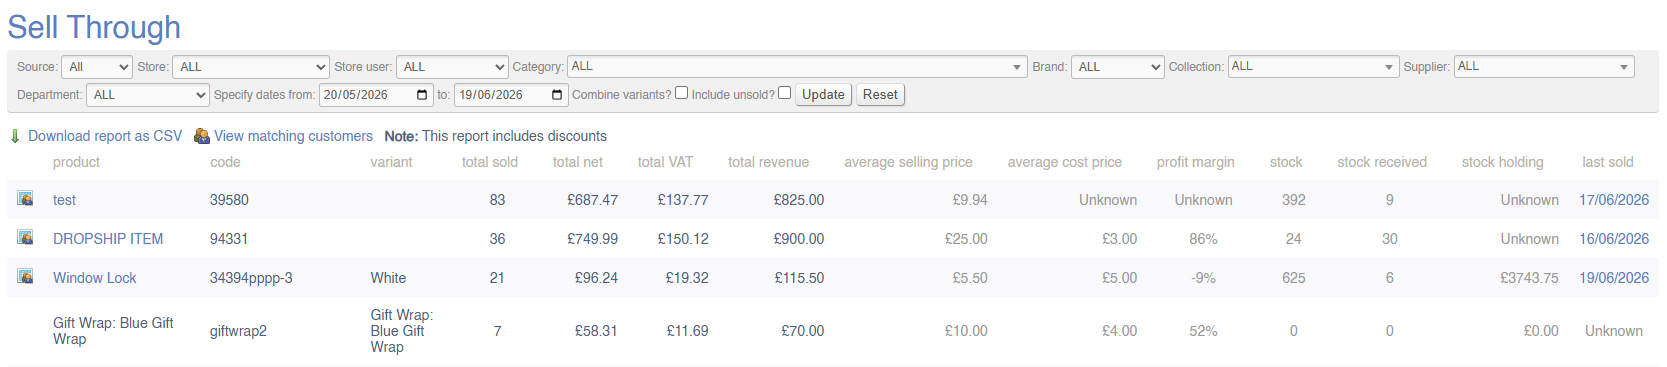
# Sell Through
This report will show a breakdown of company-wide sales within a given period; the value of sales will be split by Variant.
If you prefer, use the Combine Variants checkbox to view this report by Product instead of by Variant.
By default, this report will exclude unsold items, but it is possible to include unsold items by using the checkbox.
[](https://bookstack.iconography.co.uk/uploads/images/gallery/2026-06/pawimage.png)
#### Filters
This report may be filtered by:
- Source
- Device
- Store
- Store User
- Department
- Category
- Brand
- Collection
- Supplier
- Date Range
#### Key to icons
[](https://bookstack.iconography.co.uk/uploads/images/gallery/2024-11/wwAimage.png) = view customers who bought this product in this time period
 = download report
 = view matching customers (customers who completed a purchase within this date range and matching any other filters applied)
For more information on margin calculation, click [here](https://bookstack.iconography.co.uk/books/general/page/margin-calculation)
### Fields
| Field | Purpose |
| Stock Added | This column shows stock added to the system within the selected time period. This will include:
- Manual Adjustments
- Stock Transfers
- Goods In
- Stock Take
- Returns
It does not deduct from this figure to allow for stock leaving the business by any reason
|
### FAQs
FAQs for Sales Reports may be viewed [here](https://bookstack.iconography.co.uk/books/sales-reports/page/faqs "FAQs").
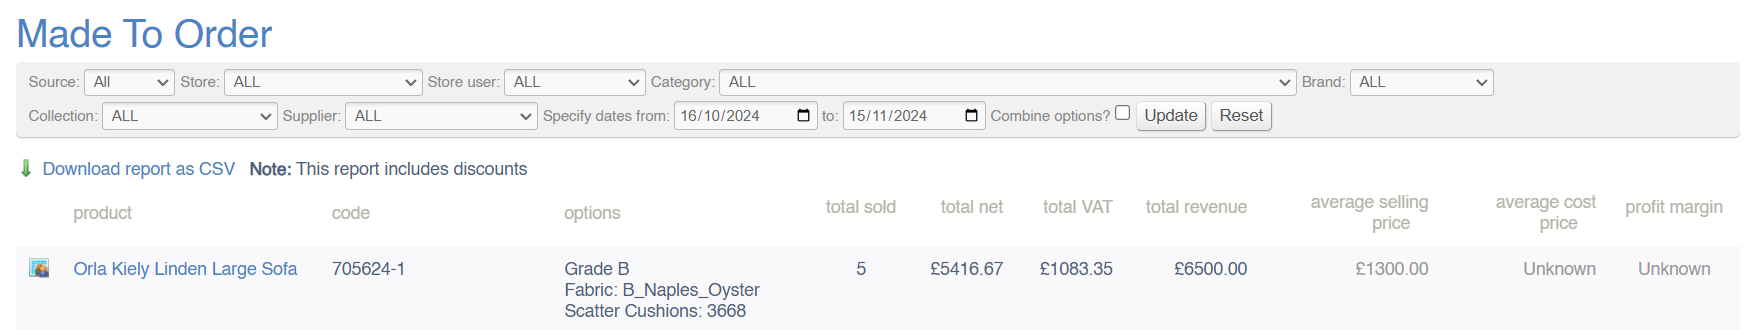
# Made to Order
This report will show a breakdown of company-wide sales of Made to Order products within a given period; this data is broken down by product and by options. This list is based on the data you have set up in the [Collections](https://bookstack.iconography.co.uk/books/collections "Collections") menu.
A single SKU may be listed here multiple times, as there will be a separate listing for each combination of Customisations, e.g. 'Blue' with 'Oak Feet' will be separate to 'Blue' with 'Black Feet'.
[](https://bookstack.iconography.co.uk/uploads/images/gallery/2024-11/FWMimage.png)
#### Filters
This report may be filtered by:
- Source
- Device
- Store
- Store User
- Category
- Brand
- Collection
- Supplier
- Date Range
#### Key to icons
[](https://bookstack.iconography.co.uk/uploads/images/gallery/2024-11/KEOimage.png) = view sales from this Collection in the [Sell Through](https://bookstack.iconography.co.uk/books/sales-reports/page/sell-through "Sell Through") report (matching any other filters applied)
 = download report
 = view matching products (products sold within this date range and matching any other filters applied)
 = view matching customers (customers who completed a purchase within this date range and matching any other filters applied)
### FAQs
FAQs for Sales Reports may be viewed [here](https://bookstack.iconography.co.uk/books/sales-reports/page/faqs "FAQs").
# Sales by User
Old report, since migrated to [Performance by User](https://bookstack.iconography.co.uk/books/sales-reports/page/faqs).
# Sales by Area
This report will show a breakdown of company-wide sales within a given period; the value of sales will be split by billing address.
[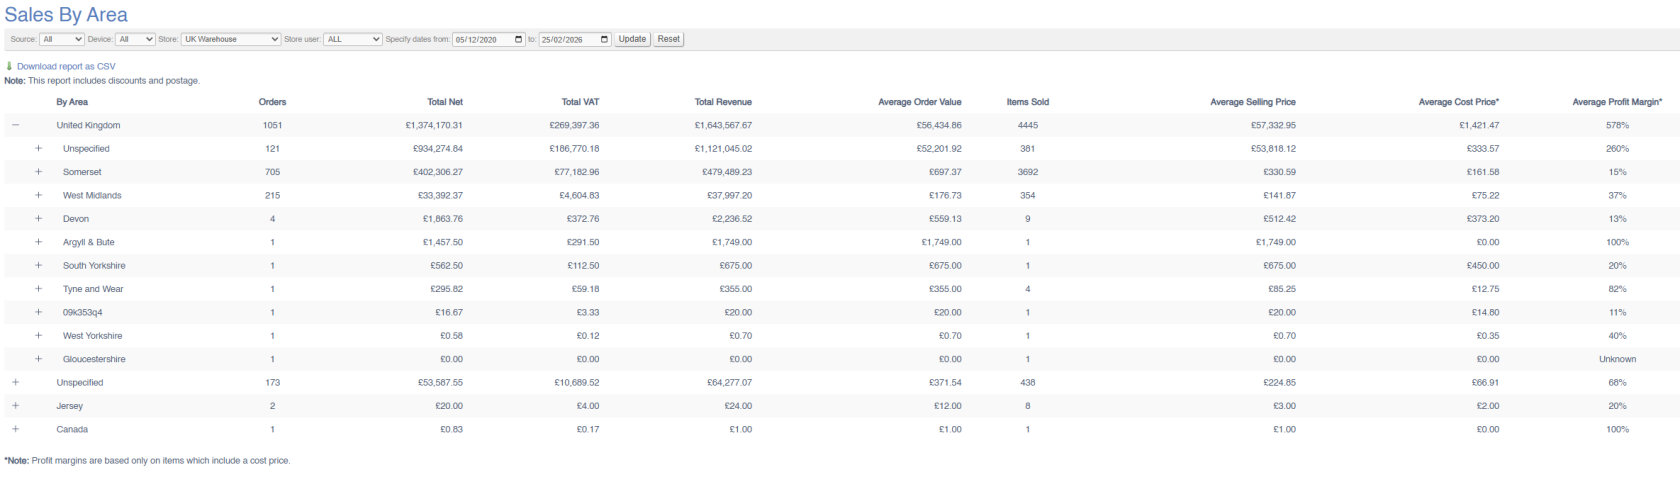](https://bookstack.iconography.co.uk/uploads/images/gallery/2026-02/image.png)
#### Filters
This report may be filtered by:
- Source
- Device
- Store
- Store User
- Date Range
#### Key to icons
 = download report