
FAQs
Sales and Revenue
What is a 'Sale'?
The Sales Reports report on revenue generated on a specific date. Revenue is defined as the total value of an order, including all Products, Addons, Discounts and Delivery.
Revenue is separate to payments, which are reported on separately under Payment Reports.
Which Orders and Order Lines will form part of revenue reporting?
Orders with the following statuses are excluded from revenue reporting:
- Draft
- Quote
- Abandoned
In addition, Order Lines with the following statuses are ignored (as they value will have been set to £0.00)
- Cancelled
- Returned
Real Time Data
Are the reports up to date?
All reports show a snapshot of data at the instant that they were generated. As such, they are always up to date.
The value of a Sales Order has changed; how will this be reflected in the reporting?
With the exception of Sales by User, all revenue reporting is done based on the Sales Order date. That means that a Sales Order that has a date of the 1st of October will always report its revenue as the 1st of October, even if new lines are added on the 1st November.
The Salesperson on a Sales Order has changed; how will this be reflected in the reporting?
This will immediately update and change all reports. This will adjust how reports are filtered, and will also have a direct impact on the Sales by User report.
The Store on a Sales Order has changed; how will this be reflected in the reporting?
This will immediately update and change all reports. This will adjust how reports are filtered, and will also have a direct impact on the Sales by Channel report.
Average Cost Prices and Profit Margins
What is an 'Average Cost Price' and how is it calculated?
An Average Cost Price represents the mean cost of all items sold within a specific period. It’s calculated by dividing the total cost of all products sold by the total number of units sold. This metric helps businesses understand the average expense of acquiring or producing the goods they’ve sold, allowing for better profitability analysis.
Depending on the report, this might be done per SKU (Sell Through report), or it might provide an Average Cost Price by Brand (Sales by Brand), or Department (Sales by Department), etc.
Example
Suppose you have a Sales by Brand report for the brand "Brand A" covering the period from January 1 to January 31.
Within this time frame, the following sales occurred:
| Product | Quantity Sold | Cost Price per Unit |
| Product 1 | 10 | £5.00 |
| Product 2 | 20 | £7.00 |
| Product 3 | 15 | £6.50 |
To calculate the Average Cost Price for Brand A during January:
-
Sum up the Cost Prices:
- Product 1: 10 units × £5.00 = £50.00
- Product 2: 20 units × £7.00 = £140.00
- Product 3: 15 units × £6.50 = £97.50
-
Total Cost Price: £50.00 + £140.00 + £97.50 = £287.50
-
Total Quantity Sold: 10 + 20 + 15 = 45 units
-
Calculate the Average Cost Price:
- £287.50 ÷ 45 units = £6.39 (rounded to 2 decimal places)
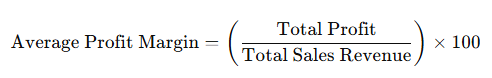
What is an 'Average Profit Margin' and how is it calculated?
An Average Profit Margin measures the percentage of profit a business earns on its sales after accounting for costs. Depending on the report, this might be done per SKU (Sell Through report), or it might provide an Average Cost Price by Brand (Sales by Brand), or Department (Sales by Department), etc.
Example
An Average Profit Margin on the Sales by Brand report will look for all sales of Products assigned to that Brand that took place within the specified period. It will then total the cost price of those items and compare it to the total sales revenue to produce an Average Profit Margin using the below formula (please note that all margins are calculated net of VAT):
Period: February 1 - February 28
| Product | Quantity Sold | Cost Price per Unit | Selling Price per Unit |
|---|---|---|---|
| Product 4 | 30 | £4.00 | £6.00 |
| Product 5 | 25 | £10.00 | £15.00 |
| Product 6 | 10 | £20.00 | £30.00 |
-
Calculate the Total Sales Revenue:
- Product 4: 30 × £6.00 = £180.00 = £150.00 ex VAT
- Product 5: 25 × £15.00 = £375.00 = £312.50 ex VAT
- Product 6: 10 × £30.00 = £300.00 = £250.00 ex VAT
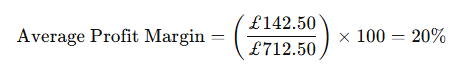
Total Sales Revenue = £180.00 + £375.00 + £300.00 = £855.00 = £712.50 ex VAT
-
Calculate the Total Cost:
- Product 4: 30 × £4.00 = £120.00
- Product 5: 25 × £10.00 = £250.00
- Product 6: 10 × £20.00 = £200.00
Total Cost = £120.00 + £250.00 + £200.00 = £570.00
-
Calculate the Profit After Tax:
- Profit After Tax = £712.50 - £570.00 = £142.50
-
Calculate the Average Profit Margin:
Why do some reports say 'Unknown' (e.g. Average Cost Price and Profit Margin)?
This will be because IXO Commerce is missing data - nothing is recorded against Sales Orders for cost price. Without a cost price, it is not possible to calculate Average Cost Price or Profit Margin.
Real Time Data
Are the reports up to date?
All reports show a snapshot of data at the instant that they were generated. As such, they are always up to date.
The value of a Sales Order has changed; how will this be reflected in the reporting?
With the exception of Sales by User, all revenue reporting is done based on the Sales Order date. That means that a Sales Order that has a date of the 1st of October will always report its revenue as the 1st of October, even if new lines are added on the 1st November.
The Salesperson on a Sales Order has changed; how will this be reflected in the reporting?
This will immediately update and change all reports. This will adjust how reports are filtered, and will also have a direct impact on the Sales by User report.
The Store on a Sales Order has changed; how will this be reflected in the reporting?
This will immediately update and change all reports. This will adjust how reports are filtered, and will also have a direct impact on the Sales by Channel report.
General
Are Reports sortable?
All reports are sortable - simply click on the headers.
Can a report be exported?
All reports are exportable as a CSV.